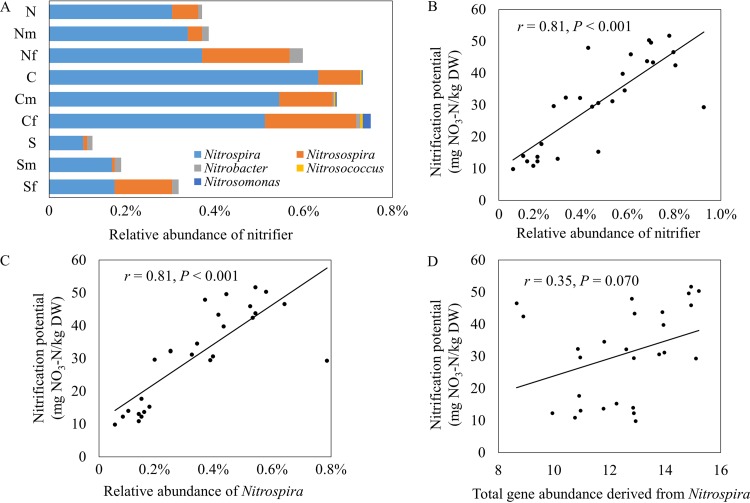
FIG 2 .
Abundances of nitrifiers and their relationships with nitrification potentials. (A) Distribution of nitrifier abundances. The N, C, and S abbreviations refer to sample sites, and the suffix of “m” and “f” indicate maize cropping and NPK fertilization, respectively. (B) Pearson correlation between the total abundance of nitrifiers and nitrification potential. (C) Pearson correlation between the relative abundance of Nitrospira and nitrification potential. (D) Pearson correlation between gene abundance derived from Nitrospira in GeoChip and nitrification potential. The nitrification potential shown in panels B to D is shown per kilogram of weight (dry weight [DW]). Correlation r and P were determined by Pearson correlation and TDIST tests, respectively.

