Figure 5.
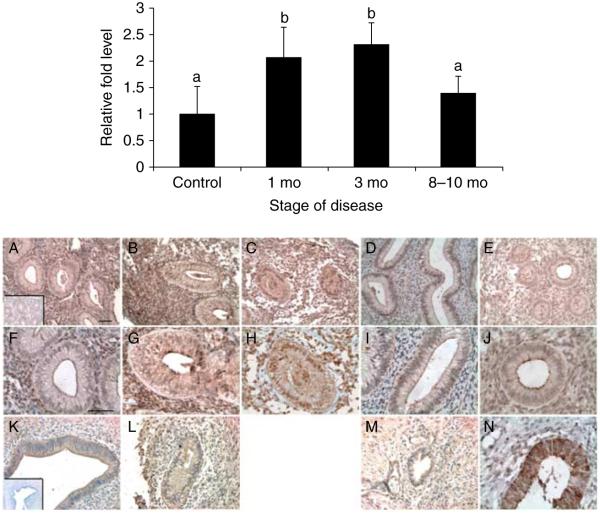
Top panel: quantitative PCR of BSG mRNA levels in the baboon eutopic endometrium throughout the development of endometriosis. Relative fold levels of BSG mRNA at each timepoint were normalized to BSG mRNA levels of d10PO disease-free controls. H3F3 mRNA levels served as an endogenous control (statistical significance from controls indicated for each sample by different letters P<0.05; mo=month). Bottom panel: immunohistochemical analysis of BSG protein localization in the matched eutopic and ectopic baboon endometrium at various stages of disease development. (A, F, and K) 3 months of disease, (B, G, and L) 6 months of disease, (C and H) 9 months of disease, (D, I, and M) 15 months of disease, (E and J) spontaneous disease (A and K inset) isotype control IgG, and (N) control d10PO endometrium. A–J and N=eutopic endometrium and K–M=ectopic endometrium. A–E bar=50 μm, F–N bar=50 μm (n=3 for each disease stage).

