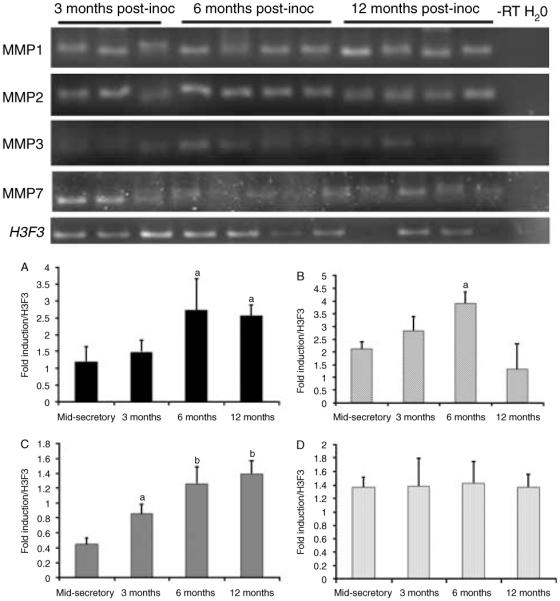
Figure 6.

Top panel: semi-quantitative PCR of MMP gene expression in the endometrium from diseased animals. Bottom panel: densitometric analysis of MMP1, -2, -3, and -7 for each cycle stage was normalized to background and calibrated to H3F3 endogenous control gene expression; A=MMP1, B=MMP2, C=MMP3, and D=MMP7 (significance is indicated by different letters, P<0.05).
