Fig. 3.

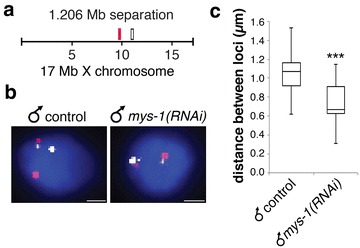
Male X chromatin decondensation is evident at the genomic scale of 1.2 Mb. a FISH probe pairs across the X chromosome. The position of YAC probes (red and white boxes) used in FISH is indicated. b 2D projections of 3D stacked images. Representative tetraploid nuclei of adult males fed vector RNAi and mys-1(RNAi) stained with probe pairs across the X chromosome (red and white) and counterstained with DAPI (blue) to label DNA. Scale bars equal 1 µm. c Boxplots indicating the distribution of 3D loci distances of male vector RNAi (n = 20) and mys-1(RNAi; n = 16) diploid nuclei. Boxes show the median and interquartile range of the data. Asterisks indicate level of statistical significance by t-test analysis (***P < .001)
