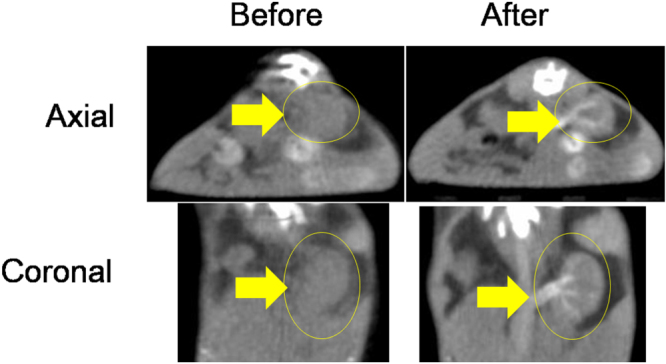
Figure 8.

In vivo CT images of a mouse before (left) and after (right) intravenous injection of an aqueous sample suspension of D-glucuronic acid coated Na2WO4 nanoparticles into the tail vein: axial images (top) and coronal images (bottom). The kidney is labeled with an arrow and a circle.
