Figure 3.
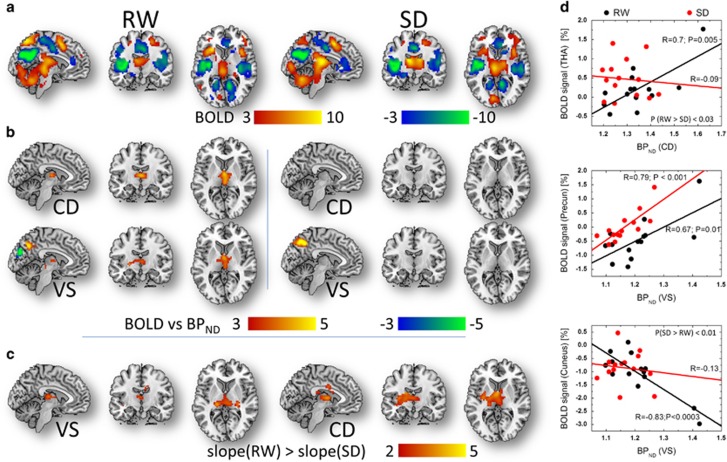
Visual attention activation versus dopamine (DA) receptors. Statistical significance (t-score) maps of brain activation responses for (a) rested wakefulness (RW) and for sleep deprivation (SD) conditions superimposed on three orthogonal views of the human brain (PFWE<0.0001) and (b) simple linear regression (SLR) slopes demonstrating the linear association across subjects between brain activation responses and D2/D3R separately for caudate (CD) and ventral striatum (VS; PFWE<0.001). (c) For VS and CD, the SLR slopes in the thalamus were significantly steeper for RW than for SD (PFWE<0.02). (d) Scatter plots showing the linear associations between D2/D3R measures in caudate (CD) and ventral striatum (VS), and the blood-oxygen-level dependent (BOLD) signals in thalamus, precuneus and cuneus, independently for the rested wakefulness (RW) and sleep deprivation (CD) conditions. Sample size: 14 healthy, non-smoking, right-handed men. FWE, family-wise error.

