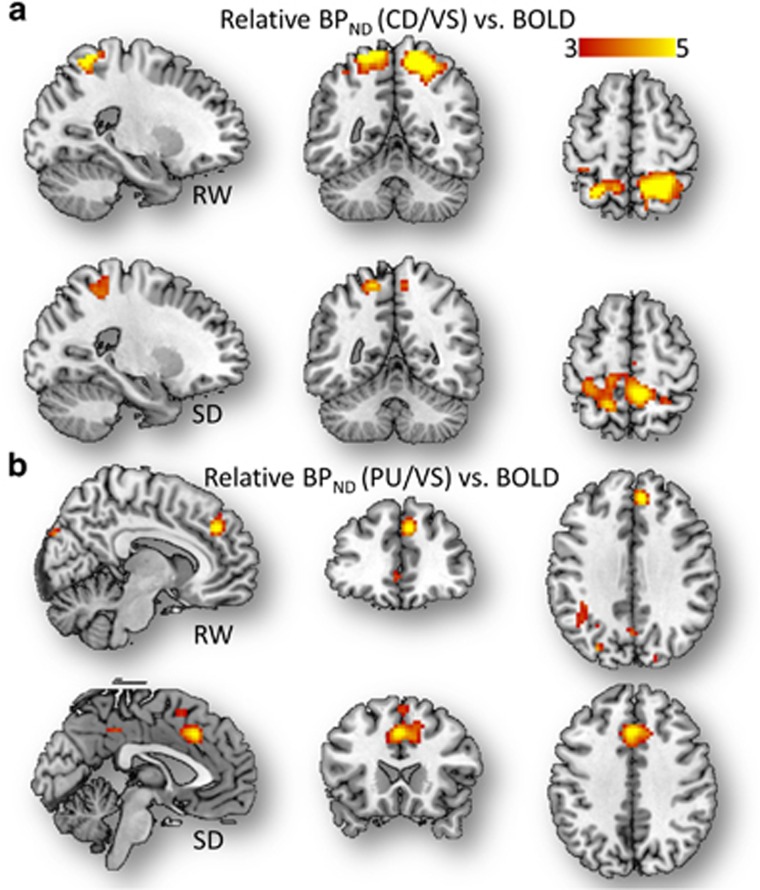
Figure 4.
Parietal activation versus relative D2/D3R in dorsal to ventral striatum. (a and b) Statistical significance (t-score) maps for simple linear regression (SLR) slopes demonstrating the linear association across subjects between brain activation responses and the caudate (CD) to ventral striatum (VS) (a) and putamen (PU) to VS (b) ratios of D2/D3R measures for rested wakefulness (RW) and for sleep deprivation (SD), superimposed on three orthogonal views of the human brain. Sample size: 14 healthy, non-smoking, right-handed men. Significance threshold: PFWE<0.002, cluster corrected for multiple comparisons in the whole brain. BOLD, blood-oxygen-level dependent; FWE, family-wise error.

