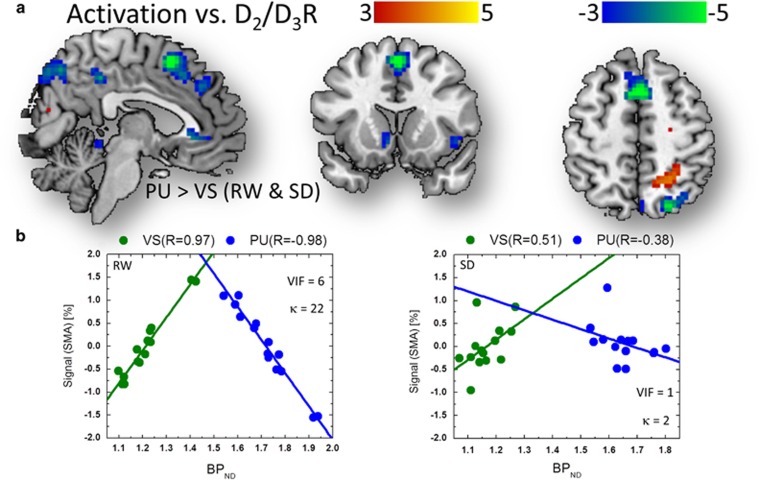
Figure 6.
Balanced dopaminergic (DAergic) effects on prefrontal activation. (a) Statistical significance (t-score) maps for multiple regression analysis (MLR) slopes demonstrating the negative linear associations across subjects between average non-displaceable binding potential (BPND) measures in putamen (PU) and ventral striatum (VS) and brain activation responses in the supplementary motor area (SMA; blue-green pattern) during visual attention for rested wakefulness (RW) and for sleep deprivation (SD; conjunction analysis), superimposed on three orthogonal views of the human brain. Significance threshold: PFWE<0.005, cluster corrected for multiple comparisons in the whole brain. (b) Scatter plots showing the linear associations between the predicted signals (BPNDVS and BPNDPU; see the 'Methods' section) in SMA and the corresponding BPND measures in PU and VS.

