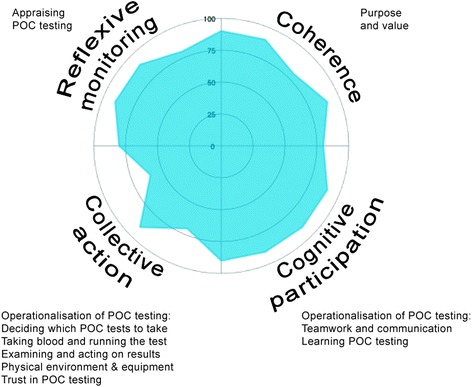
Fig. 1.

Radar plot showing the extent to which the data supports each construct of NPT. Closer proximity of the shaded area to the outer line of the circle indicates greater strength, and closer proximity of the shaded area to the centre of the circle represents lesser strength, assigned to that construct
