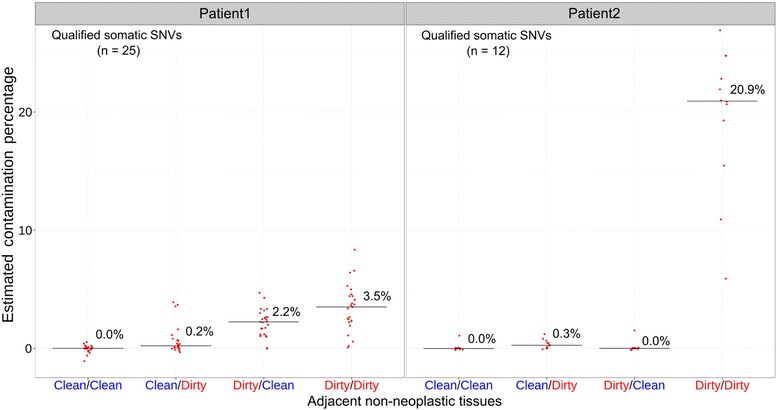
Fig. 4.

The estimated contamination levels in adjacent non-neoplastic tissues by targeted amplicon sequencing. Each red dot represents a previously identified somatic SNV. The contamination level was estimated by: (VAF_in_non-neoplastic_tissue - VAF_in_blood)/VAF_in_neoplasm. The median contamination levels for each non-neoplastic sample are plotted as a horizontal bar with the percentage displayed in numeric value
