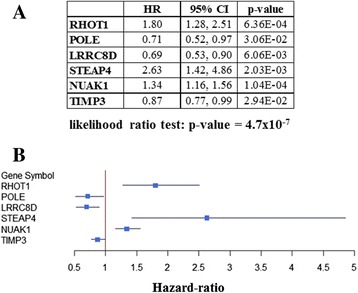
Fig. 6.

Multivariate survival analysis of the 34 selected genes. a Table with hazard-ratio (HR) or risk of death, with 95 % CIs and p-values for each of the genes independently associated with survival. b Forest plot of independently significant genes for survival. Blue boxes represent hazard-ratios (HR), and lines are their CIs. HR = 1 is non-significant. HR < 1 has decreased risk of death; HR > 1 has increased risk of death. Overall p-value of the survival model: p = 5.7×10⁻⁷
