Fig. 2.

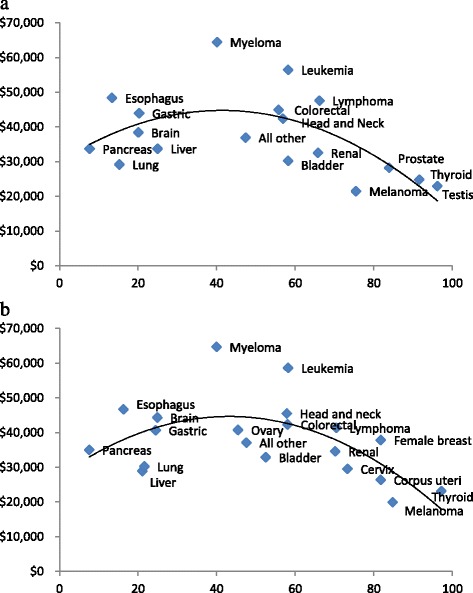
Association between discounted 5-year net costs by percentage of patients alive 5 years after diagnosis for males a and females b (trendline is a polynomial of order 2)

Association between discounted 5-year net costs by percentage of patients alive 5 years after diagnosis for males a and females b (trendline is a polynomial of order 2)