
Figure 5.
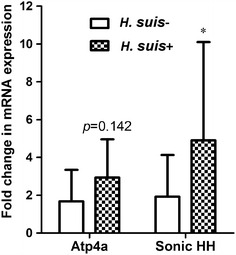
mRNA expression analysis. Shown are the mean fold changes of mRNA expression in H. suis positive pigs (n = 15) for Atp4a and Sonic HH, compared to that in H. suis negative pigs (n = 15). An * indicates a statistically significant difference (Student t test, p < 0.05) between H. suis positive pigs (H. suis−) and H. suis negative pigs (H. suis+). Sonic HH: sonic hedgehog.