
Fig. 3.
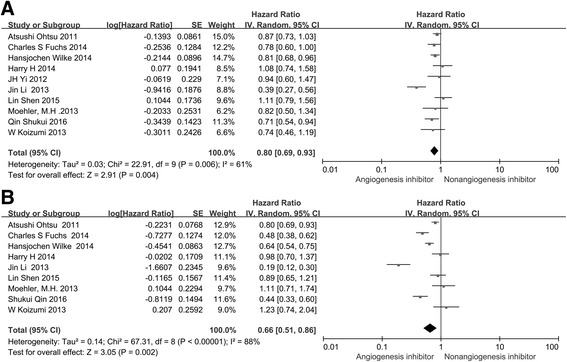
Forest plot and pooled HR and 95 % CI for OS (a) and PFS (b): anti-angiogenesis therapy versus non-anti-angiogenesis therapy. The pooled HR for OS and PFS showed that the patients receiving anti-angiogenesis therapy possessed a significant improvement in OS and PFS. HR hazard ratios, OS overall survival, PFS progression-free survival, CI confidence intervals