
Fig. 4.
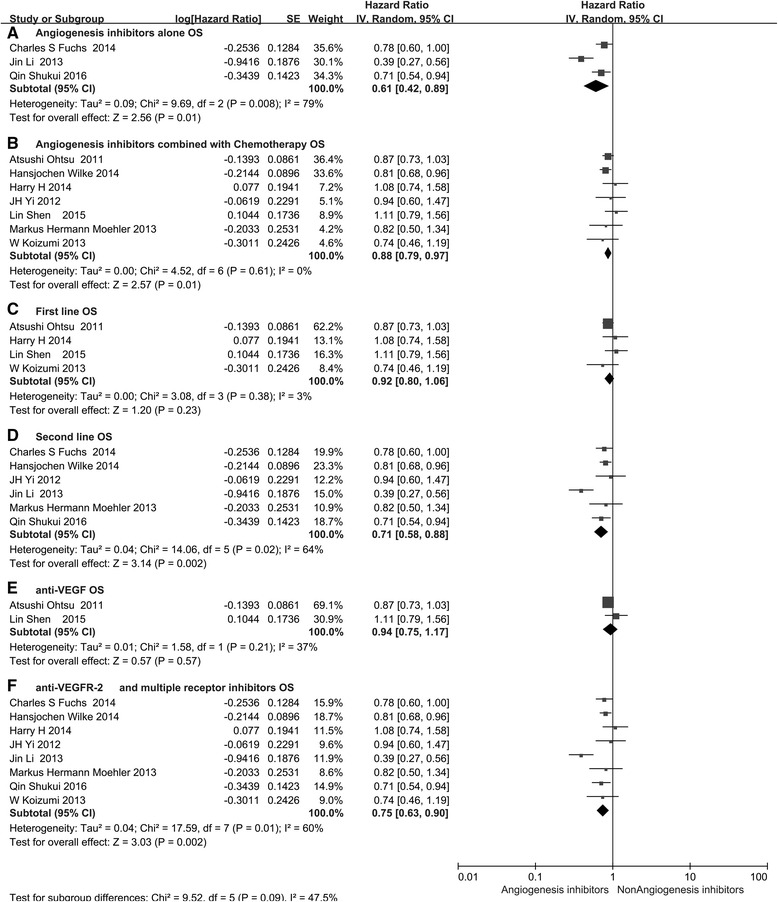
Forest plot and pooled HR and 95% CI for subgroup OS: anti-angiogenesis therapy versus non-anti-angiogenesis therapy. HR hazard ratios, CI confidence intervals, OS overall survival. (a: OS of subgroups of angiogenesis inhibitors alone threapy; b: OS of subgroups of angiogenesis inhibitors combined with chemotherapy threapy; c: OS of subgroups of the first line threapy; d: OS of subgroups of the second line threapy; e: OS of subgroups of anti-VEGF threapy; f: OS of subgroups of anti-VEGFR and multiple receptor inhibitors threapy)