
Fig. 6.
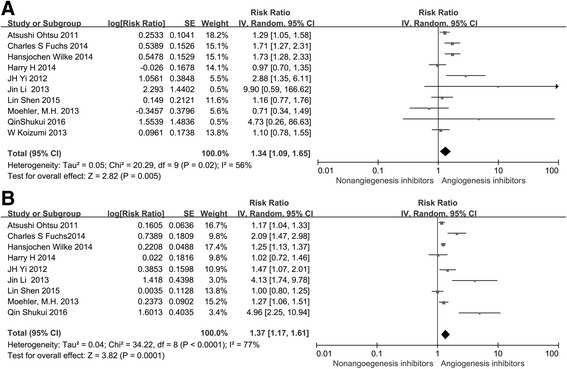
Forest plot and pooled RR and 95 % CI for DCR (a) and ORR (b): anti-angiogenesis therapy versus non-anti-angiogenesis therapy. The pooled RR for DCR and ORR showed that the patients receiving anti-angiogenesis therapy had superior DCR and ORR. RR risk ratios, CI confidence intervals, ORR overall response rate, DCR disease control rate