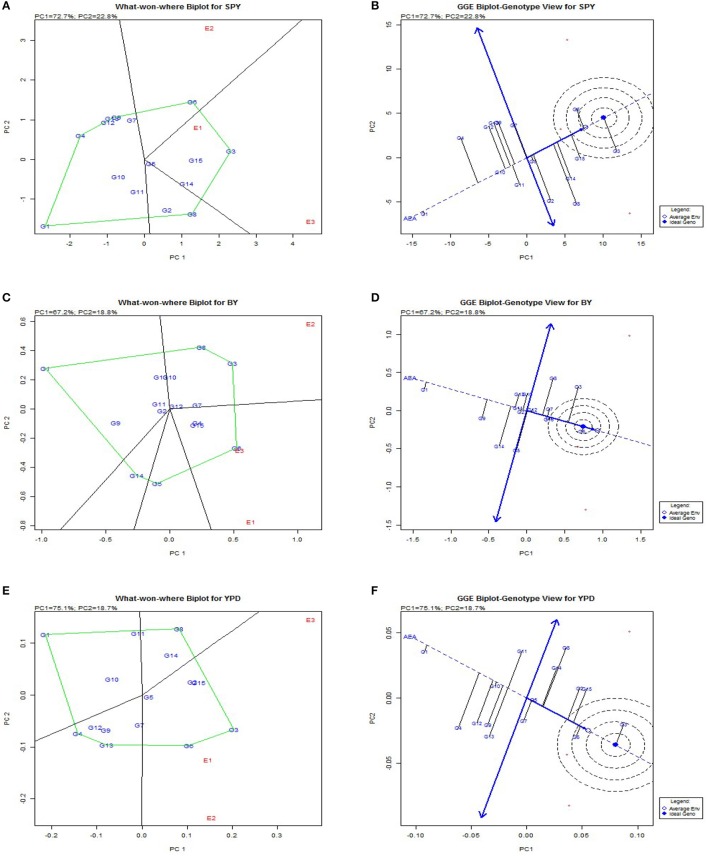
Figure 3.
Polygon views of the GGE biplot based on symmetrical scaling for “which-won-where” pattern of rice genotypes in three environments. (A), Polygon view of single plant yield. (B), which-won-where plot single plant yield. (C), Polygon view bulk yield. d which-won-where plot bulk yield. (E), Polygon view per day productivity. (F), which-won-where plot per day productivity.

