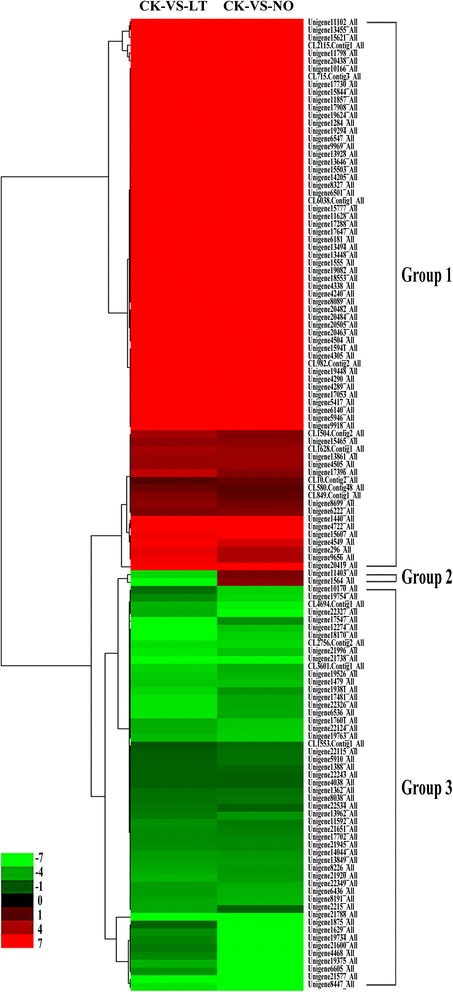
Fig. 6.

Clustering analysis of the DEGs co-expressed in CK-VS-LT and CK-VS-NO. This analysis is based on the log2Ratio values of DEGs. Columns displays the two comparisons (CK-VS-LT and CK-VS-NO), and rows represent the 125 DEGs. Up- and down-regulated gene expressions are showed by red and green, respectively. The 125 genes exhibit three expression patterns
