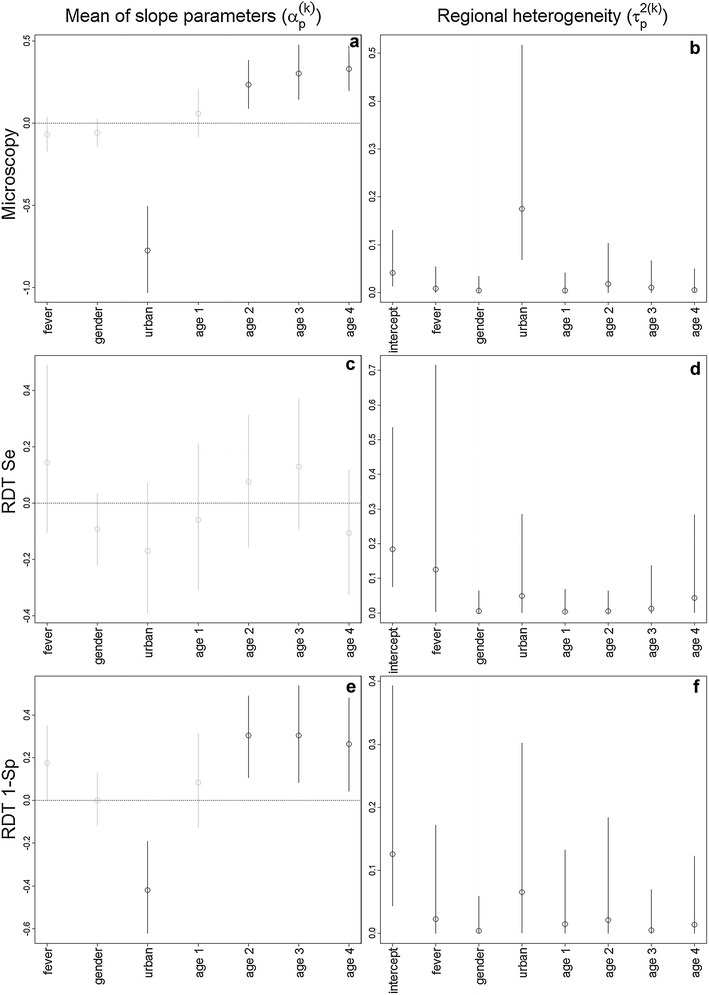
Fig. 1.

Parameter estimates (circles) and 95 % credible intervals (vertical lines). Results for the 3 different statistical models are displayed in each row of panels: microscopy (M|X; a, b), RDT sensitivity (R|M = 1,X; c, d), and one minus RDT specificity (R|M = 0,X; e, f). Age groups 1, 2, 3, and 4 refer to children 12–23, 24–35, 36–47, and 48–59 months old, respectively. Left panels depict the average of the random slope parameter p in model k (). Statistically significant parameters (i.e., 95 % credible intervals do not overlap with zero) are highlighted with black lines while non-significant results are depicted with grey lines. Right panels depict regional heterogeneity in effect sizes, represented by the variance of random parameter p in model k (). A detailed description of our statistical model is provided in Additional file 1. Se and Sp stand for sensitivity and specificity, respectively
