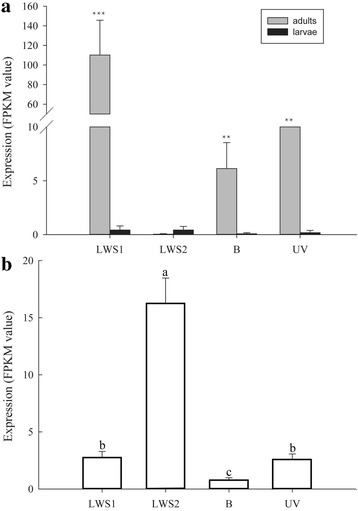
Fig. 2.

Quantitative expression levels for opsin genes in a larvae at 5th instar stage and adults and b larvae at 1st instar stage. a The “**” denote statistical significance of the expression levels at P < 0.01. The “***” denote statistical significance of the expression levels at P < 0.001. b Significant difference is shown using different letters (P < 0.0001, d.f. = 3, 12, F = 203.83). Mean ± SD. n = 4
