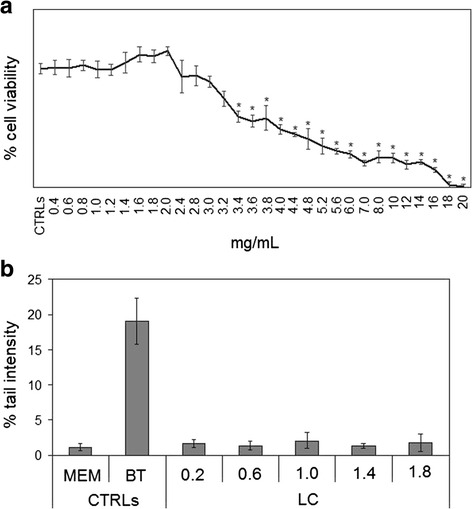
Fig. 2.

Effect of LC berry extract on HepG2 cells. a cell viability, measured by MTT assay; b genotoxic effects, valuated by Comet Assay. In a the values are reported as % viability of the control sample, and in b the values are reported as % tail intensity with cells in MEM as negative control and cells in 100 mM 1,2,4-benzentriol (BT) as positive control. Data are expressed as mean ± SD of three independent experiments performed in duplicate
