
Fig. 3.
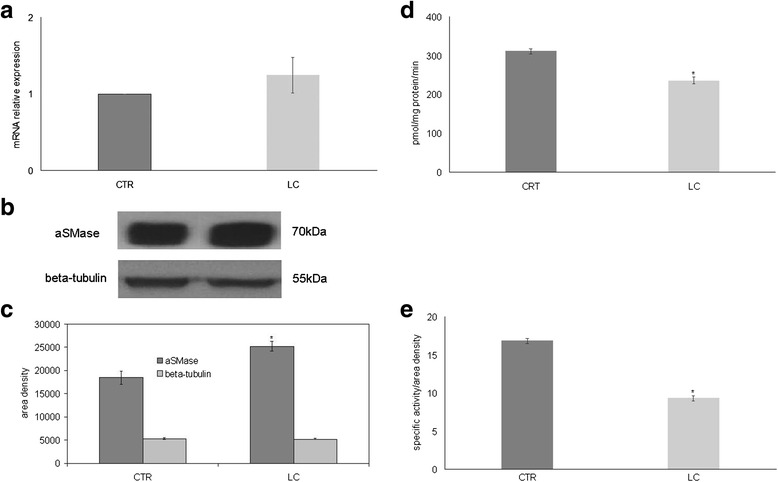
Effect of LC berry extract on acid sphingomyelinase. a gene expression evaluated by RT-PCR as fold of increase of mRNA expression relative to control sample. b immunoblotting; the position of the 70 kDa protein for aSMase and 48 kDa for beta-tubulin was indicated in relation to the position of molecular size standards. c area density evaluated by densitometry scanning and analyzed with Scion Image. d enzymatic activity; the data are expressed as pmol/mg protein/min. e enzymatic activity/ area density; the data are expressed as pmol/mg protein/min referred to area density of immunoblotting analyzed as reported in c. Data are expressed as area/mg protein. (Significance, *P < 0.001 versus control sample)