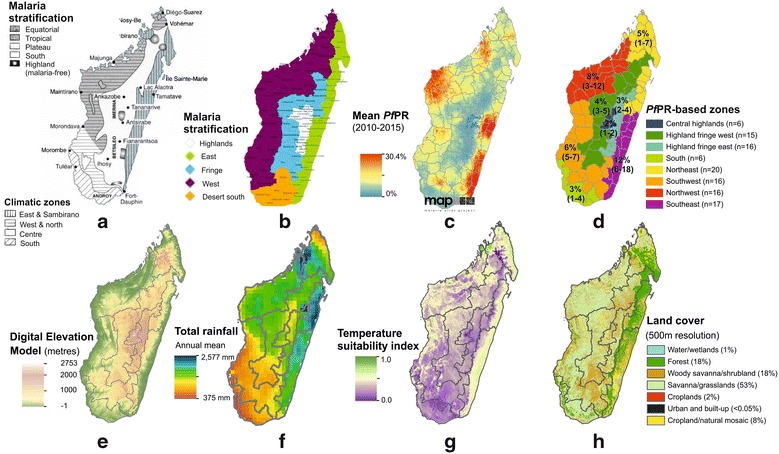
Fig. 2.

Defining a contemporary sub-national stratification of malaria transmission intensity in Madagascar. a Mouchet et al.’s stratification of malaria transmission across Madagascar (reproduced with permission [22, 23]); this map was adapted to district-level administrative boundaries and b shows the currently used adaptation of the sub-national stratification (Source: NMCP National Strategic Plan [21]). c Represents the Malaria Atlas Project (MAP) modelled map of P. falciparum prevalence in 2–10 year olds (PfPR mean surface from 2010–2015) [14], and d the updated ecozones based off the PfPR map (regional figures correspond to the mean district-level PfPR value (2010–2015), and the min–max PfPR values from the districts in each ecozone. e–h Illustrate some of the environmental covariates which informed the PfPR mapping model, and which therefore underpin the updated sub-national stratifications. e A model of digital elevation (source: Shuttle Radar Topography Mission (SRTM) [59], plotted at 1 km resolution). f Maps mean total annual rainfall (mm) from 2010 to 2014 (source: NASA Tropical Rainfall Measuring Mission (TRMM) 3B43 algorithm available at 0.25º by 0.25º spatial resolution), while g shows the annual temperature suitability for P. falciparum transmission, reproduced with permission from Weiss et al. [60]. h Summarizes land-cover use across Madagascar at 500-m spatial resolution
