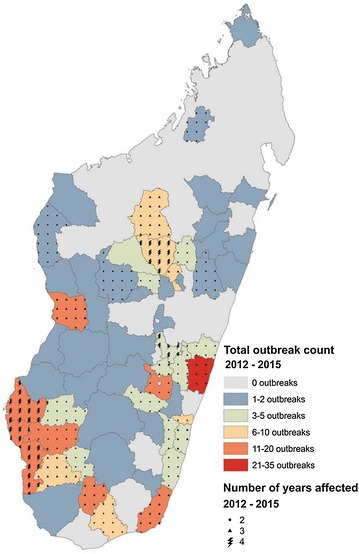
Fig. 6.

Outbreaks documented in the NMCP records for January 2012–December 2015. Outbreak definitions vary according to expected local transmission characteristics. Colours indicate the total number of outbreaks reported per district during the period examined. Overlain symbols indicate the number of years affected between 2012 and 2015. Grey background indicates no reported outbreaks
