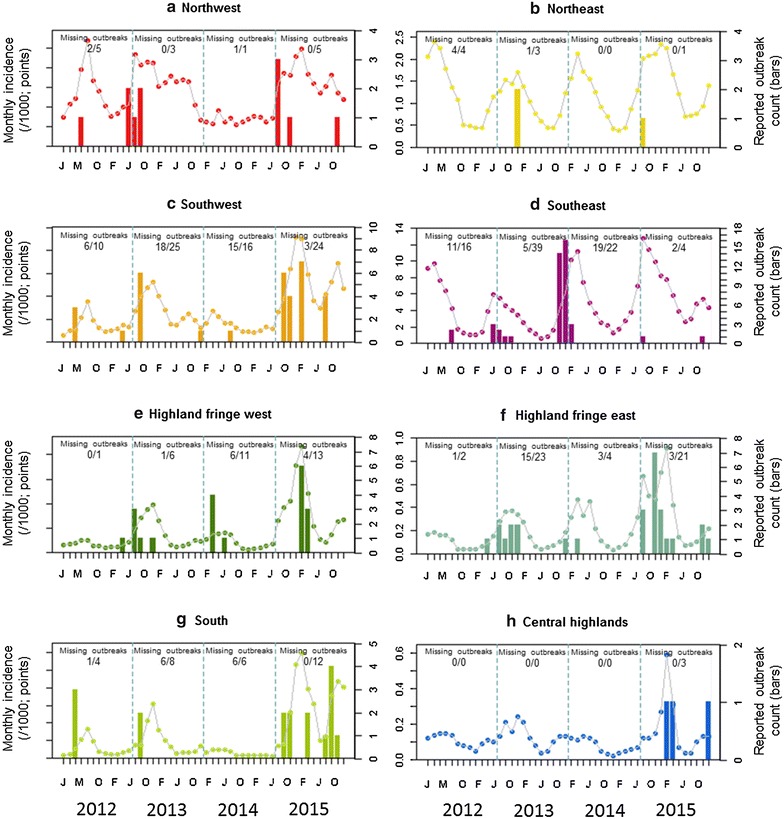
Fig. 7.

Temporal correspondence between reported malaria case incidence (left-hand y axis; plotted as points) and outbreak reports (right hand y axis; plotted as barplots) aggregated by ecozone for 2012–2015. Of the 292 outbreaks reports, nearly half (n = 133) provided no supporting information about the affected month so these could not be included in the monthly outbreak plots. The total annual outbreaks reported per ecozone is specified in the plots (fraction denominator), with the numerator summarizing the number of outbreaks missing from the bar plots due to incomplete information
