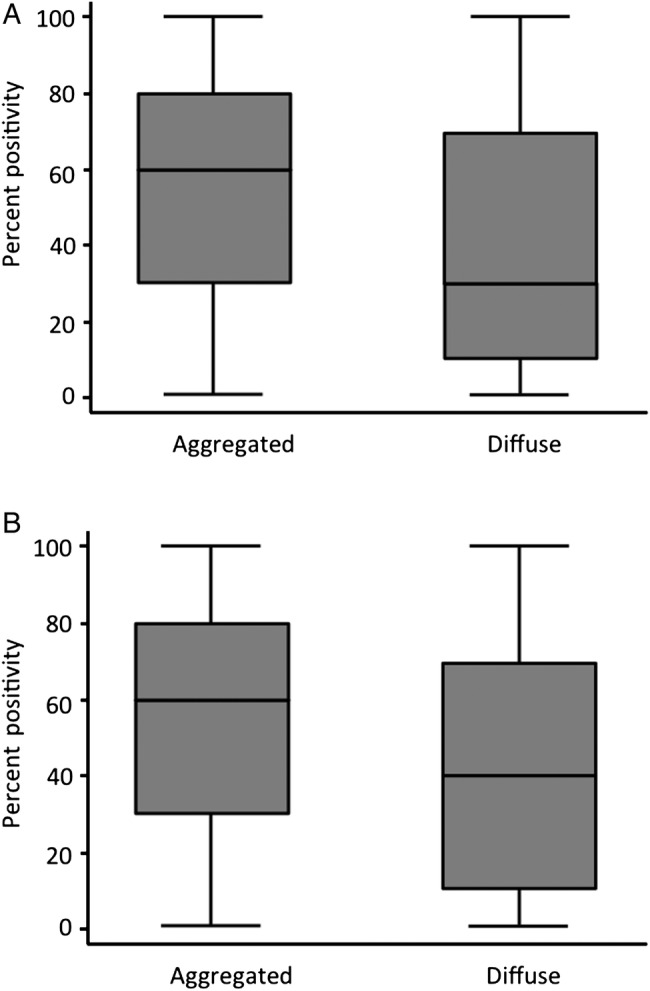
Figure 3.

Per cent progesterone receptor (PR) positivity as a function of activated PR pattern. Each box corresponds to the range of percentage values of PRA (A) or PRB (B) stained tumour cells. The limits of the boxes show the SD of the distribution, and the line the extremes, while the line inside the box is the average. The left panel compared the distribution of the percentages for aggregated pattern (activated) and diffuse pattern (inactive). The same is shown on the right for PRA. It is apparent that the boxes for each PR are not at the same levels, and in particular that the average lines are at different levels, for example, the average percentages are different. The tests used in a Kruskal-Wallis test confirm that the distributions are different between aggregated and diffuse. (A) p=0.0003; (B) p=0.001.
