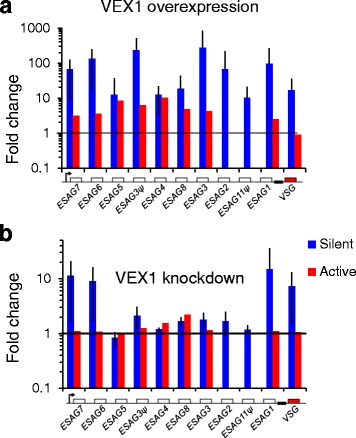
Fig. 4.

VSG-ES transcriptome analysis following VEX1 perturbation. a Average change of ‘generic’ [22] ESAG expression at either active (red) or silent (blue) VSG-ESs following overexpression of VEX1. b As in A but showing change in gene expression following knockdown of VEX1. Beneath each panel is a schematic map for each locus. Boxes, coding sequences; arrowsheads, Pol-I promoters. Black line crosses at 1 fold change (no change in expression)
