
Fig. 2.
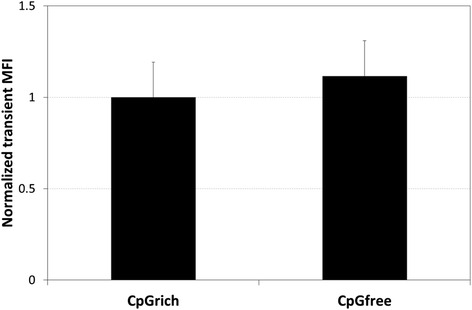
Comparing transient EGFP expression level obtained using the CpGrich and CpGfree promoters. Cells were transfected and EGFP expression levels measured using a flow cytometer after 24 h. Each bar and standard deviation represents the results obtained from duplicate experiments of three separately transfected pools. Results were normalized for transfection efficiency for each sample before normalizing to CpGrich expression level