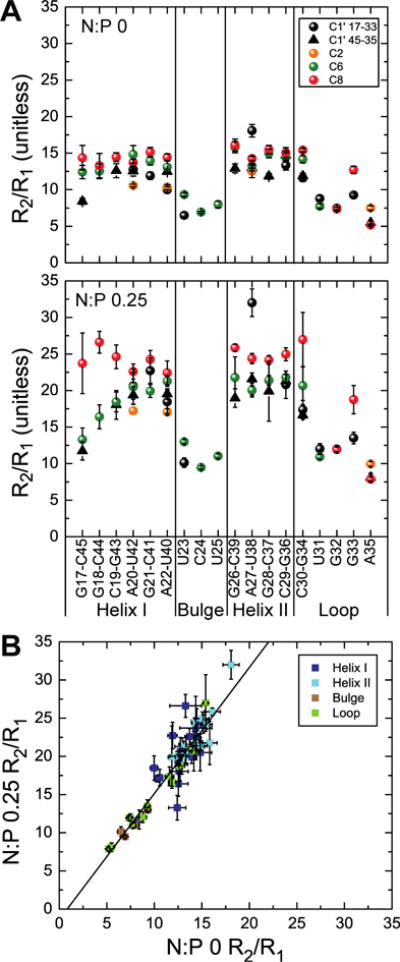
Figure 3.

Examining impact of dendrimer interaction on TAR dynamics by 13C spin relaxation (A) Ratio of 13C “transverse” relaxation (R2) to “longitudinal” relaxation (R1) values (R2/R1) measured on TAR at N:P 0 and 0.25 plotted as a function of the nucleotide residue (as base-paired in the helices or unpaired in the bulge and apical loop). Values for different nuclei are denoted using different symbols and colors (B) Correlation of measured R2/R1 values at N:P 0 and 0.25.
