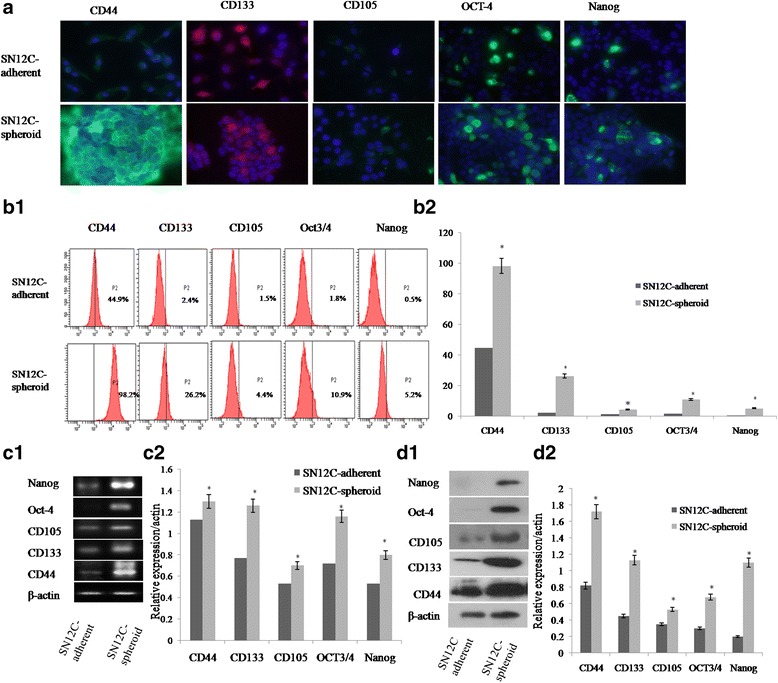
Fig. 3.

TICs-phenotype detection of spheroid and adherent cells. Representative photomicrographs depicting the higher expression of CD44, CD133, CD105, OCT-4 and Nanog in spheroid cells than adherent cells. a Immunofluorescence staining. Nuclei were labeled with DAPI (blue). Bar = 25 μm (adherent cells) or 100 μm (spheroid cells). b1, b2 Representative flow cytometric analyses of spheroid cells and adherent cells stained for stem markers. c1, c2 Semiquantitative RT-PCR was performed for analyzing expression of stem genes in the spheroid cells and adherent cells and the expression of these TICs-related genes in spheroid body cells were higher than that of adherent cells. d1, d2 Spheroid cells were enriched for expressing stem proteins by western blot analysis. * Significant differences were detected between stem markers of spheroid cells and adherent cells. Representative staining of three independent experiments is shown
