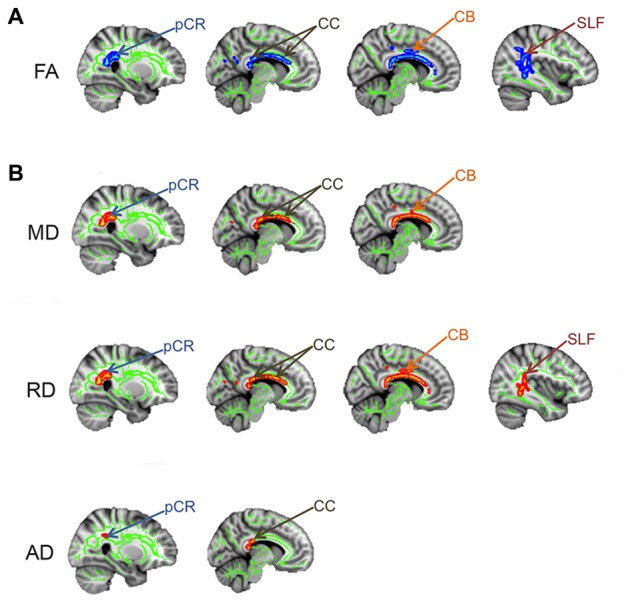
Figure 5.

Brain white matter abnormalities in TN. Tract-based spatial statistics results showing that TN patients have several regions of abnormal brain white matter, compared to controls. Specifically, TN patients had significantly lower FA (blues clusters; A) and higher MD, RD and AD (red clusters; B) in the white matter areas indicated by arrows. pCR, posterior corona radiata; CC, corpus callosum; CB, cingulum bundle; SLF, superior longitudinal fasciculus; FA, fractional anisotropy; RD, radial diffusivity; MD, mean diffusivity; AD, axial diffusivity. This figure has been reproduced from DeSouza et al. (2014) with permission (RightsLink license number: 3823931416268).
