Table 3.
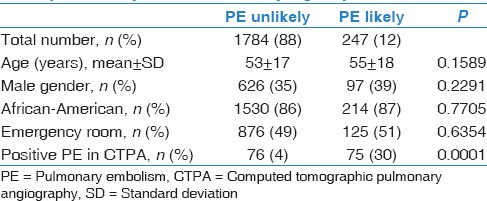
Patients’ demographics and positivity rate of computed tomographic pulmonary angiography comparison between “pulmonary embolism unlikely” and “pulmonary embolism likely” groups

Patients’ demographics and positivity rate of computed tomographic pulmonary angiography comparison between “pulmonary embolism unlikely” and “pulmonary embolism likely” groups
