Figure 5.
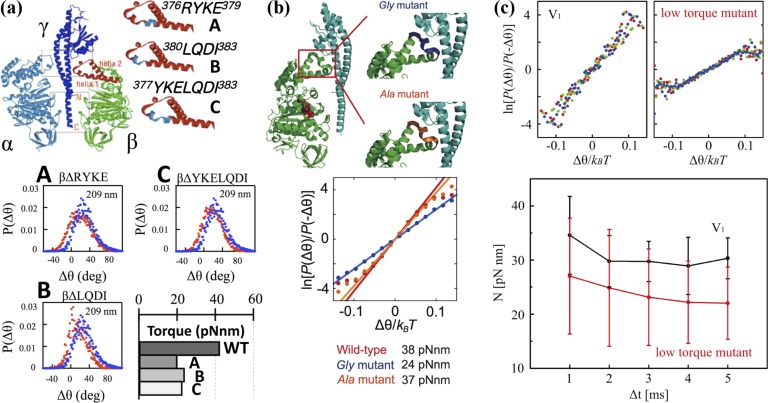
FT applied to mutants F1 and V1. (a) (top) The structures of α, β and γ subunits of the F1. Truncated sequences are shown in blue19. (bottom) P(Δθ) for the wild-type F1 (blue) and the mutants (red) probed by 209-nm sized duplex beads in the case Δt=4-ms at [ATP]=2 mM. Torque was calculated from P(Δθ) using Eq. (11). (b) (top) The structures of ß and γ subunits of the F1. Residues replaced by glycine (Gly mutant) and alanine (Ala mutant) are shown in blue and orange, respectively.(bottom) ln[P(Δθ)/P(−Δθ)] as a function of Δθ/kBT for the stepping rotations probed by magnetic beads in the case Δt=5 ms at [ATPγS]=1 mM. The recording rate was 1000 fps. (c) (top) Comparison between V1 and a rotor-modulated mutant of ln[P(Δθ)/P(−Δθ)] as a function of Δθ/kBT for the stepping rotations probed by magnetic beads in the cases Δt=3 ms (red), Δt=4 ms (green), and Δt=5 ms (blue) at [ATP]=10 μM. The recording rate was 1000 fps. (bottom) Δt dependence of N measured using Eq. (11) for V1 (black) and the mutant V1 (red). Results are the average from 5 molecules (black) and 4 molecules (red), respectively.

