
FIGURE 6.
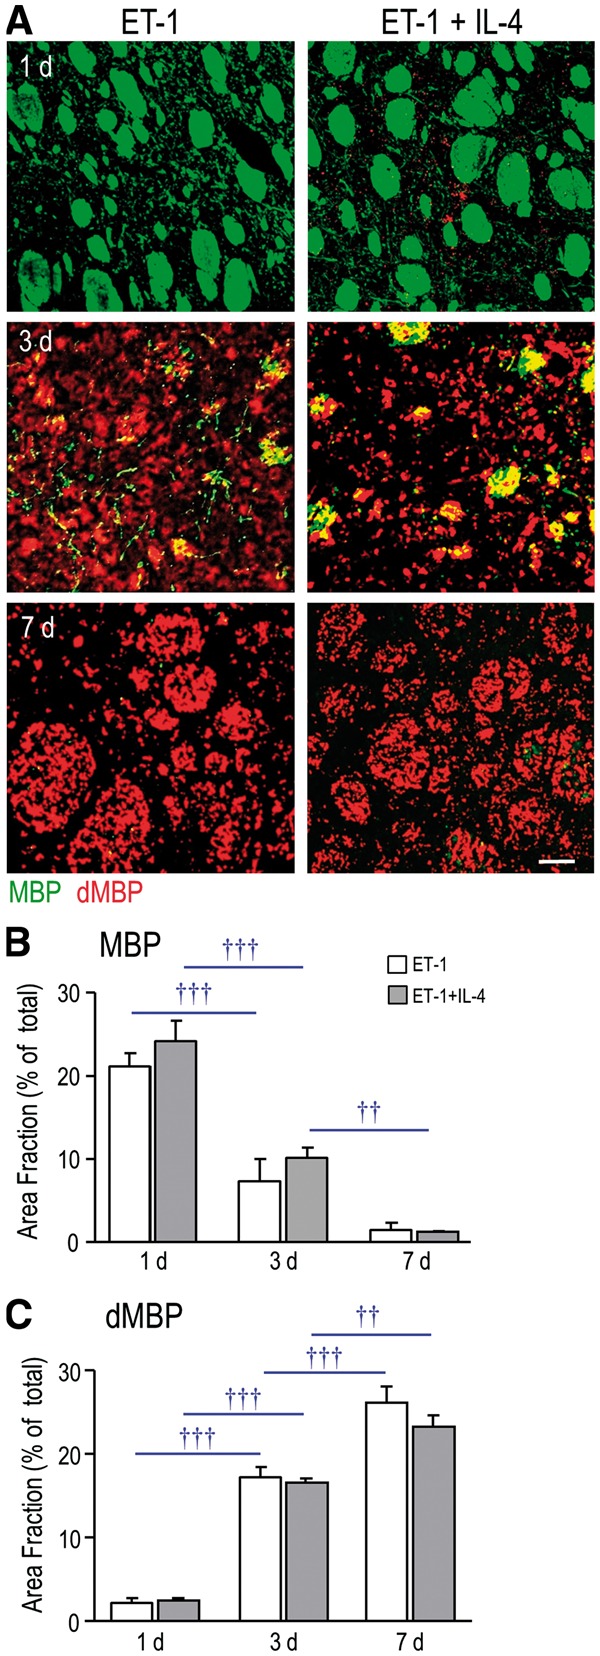
IL-4 treatment did not rescue the progressive myelin damage after ischemia. (A) Representative images of MBP (green) and dMBP (red) staining after ischemia, with and without IL-4 treatment. Scale bar = 50 μm and applies to all images. (B, C) Summary of area fraction of staining (stained area/total area) per 300 µm2 for MBP and dMBP. Time-dependent changes within each treatment group are indicated as †† p < 0.01 and ††† p < 0.001.