
Figure 11.
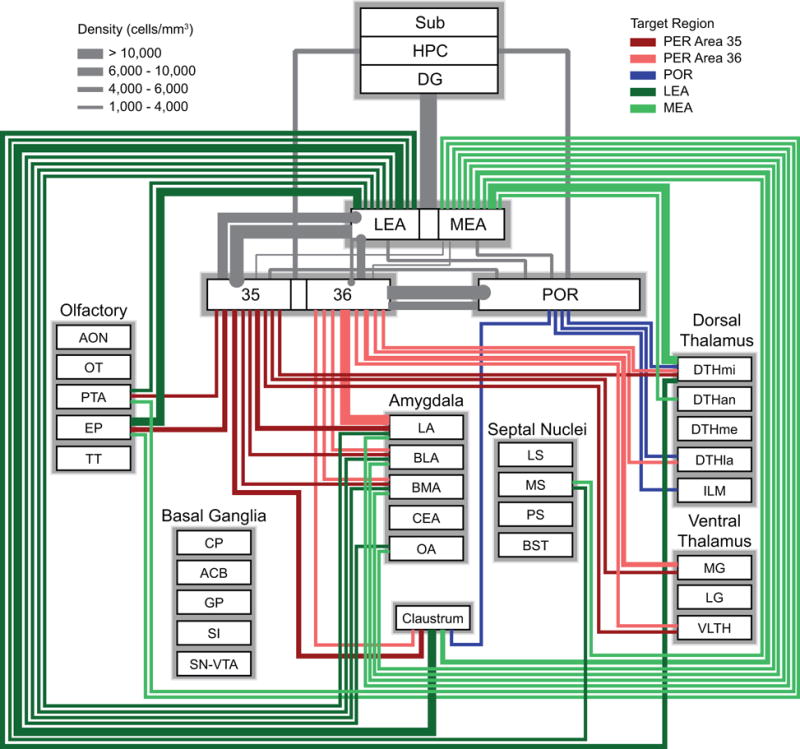
Wiring diagram based on the density measure representing subcortical output to PER areas 35 and 36, POR, LEA, and MEA). Colors represent the different target regions. Thickness of the bars represents the density of labeling in the afferent regions. This measure is useful for comparing the pattern of output of particular subcortical afferent structures to different targets. For example, the claustrum provides output to all five structures, but the strengths of those projections differ. Information for connections shown in grey are from prior studies (Agster and Burwell, 2013; Burwell and Amaral, 1998b). For simplicity, the weakest connections (< 2000 labeled cells/mm3) are not shown but can be found in Table 4. All basal ganglia connections were below 2000 cells/mm3. See Table 1 for a list of abbreviations.