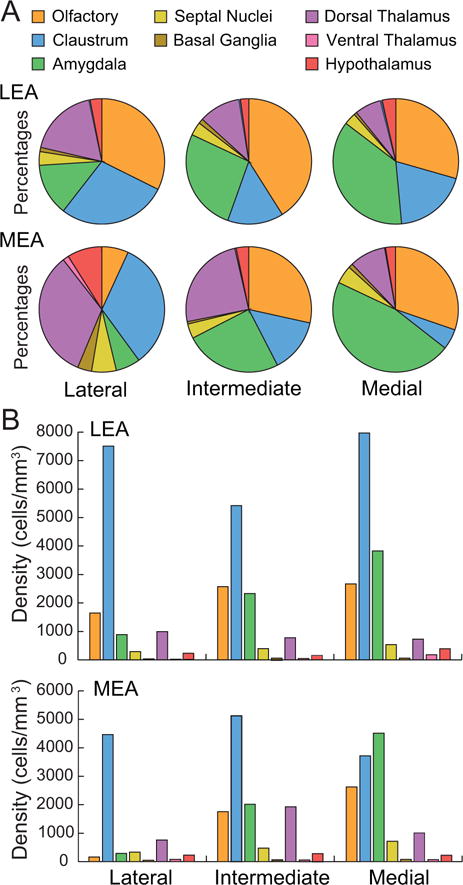
Figure 9.

Percentages and densities and labeled cells in the lateral, intermediate, and medial DG-projecting bands of the LEA and the MEA. A. Input to each LEA and MEA band as indicated by percentage of labeled cells found in each composite subcortical region. Color code in panel A also serves for panel B. The distribution of subcortical input is generally similar between the LEA and MEA bands. Amygdala input increases from the lateral to the medial bands of both LEA and MEA. Olfactory input increases from the lateral to the medial bands of MEA. Input from the claustrum decreases from lateral to medial bands for the MEA. B. Output to different bands indicated by densities of labeled cells. Average densities of labeled cells in the subcortical areas. Olfactory and amygdala structures target the medial band of both the LEA and the MEA more strongly than the lateral and intermediate bands.
