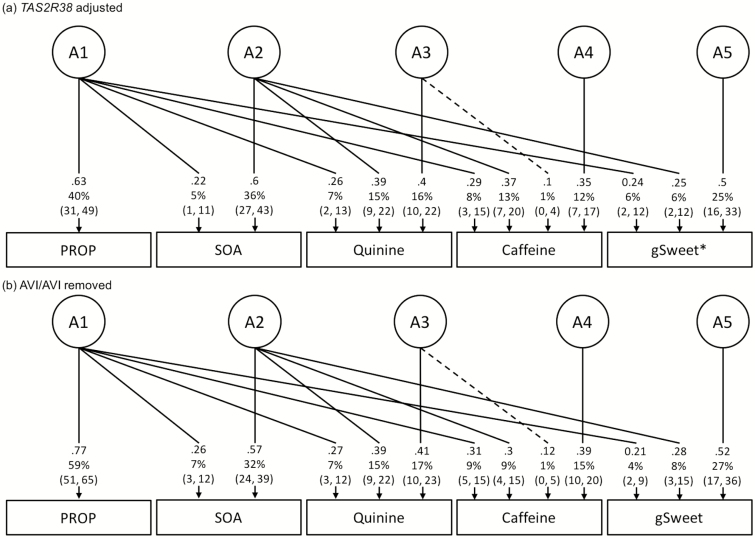
Figure 3.
The conditioned Cholesky AE models showing estimates of standardized path coefficients (can be squared to get the variance) and percentage of variance with 95% CIs and covariation between perceived intensity of PROP, SOA, quinine, caffeine, and gSweet. The boxes and the circles represent observed variables (phenotypes) and latent variables, respectively. Only additive genetic factors (A) are shown here because estimates of environmental factors (E) are not different from those estimated from the full sample (n = 1901). Dashed lines are insignificant estimates. (a) Adjusting for TAS2R38 diplotype (n = 1756). * Modelling results with gSweet replaced by glucose and fructose are shown in Supplementary Table 7. (b) Participants with TAS2R38 AVI/AVI diplotype removed (n = 1229). (See Supplementary Table 5 for absolute variance.)

