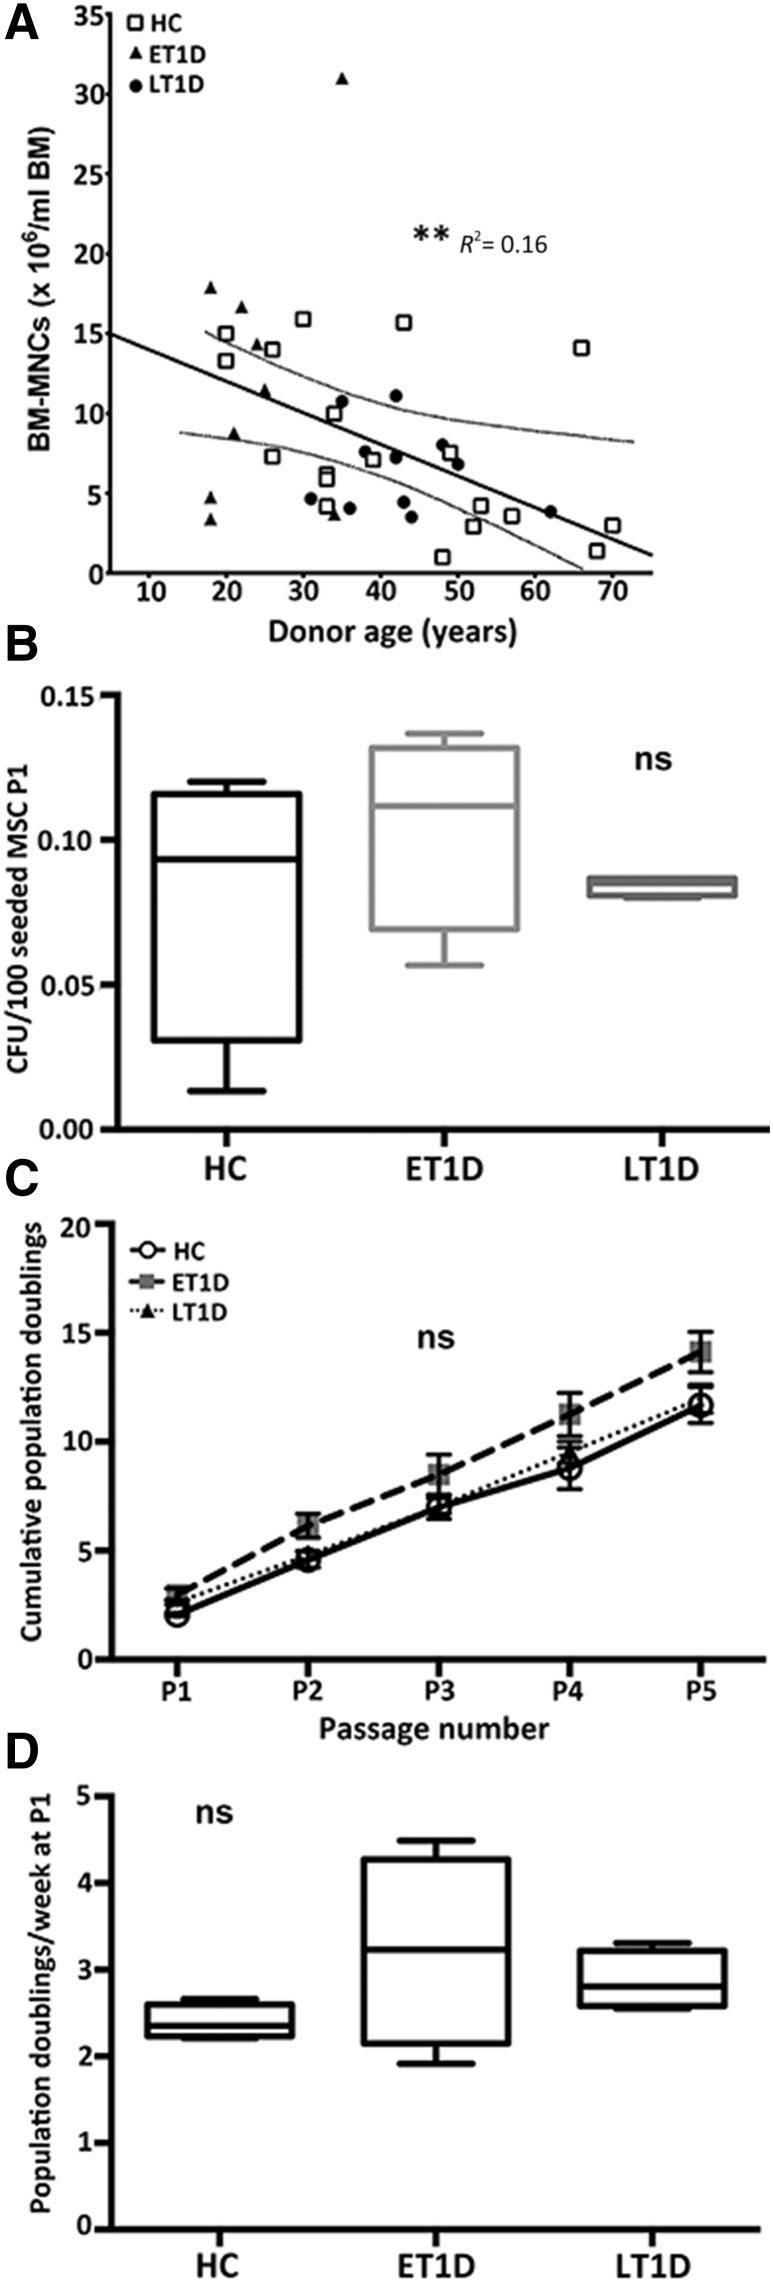
Figure 1.
Growth characteristics of MSCs from HC and T1D donors. (A): Age-dependent decline in BM-MNCs per milliliter of BM aspirated from HCs (n = 19), ET1D donors (n = 10), and LT1D donors (n = 12). (B): CFU-F per 100 MSCs at P1 for HC (n = 4), ET1D (n = 4), and T1D donors (n = 4). (C): Growth kinetics (mean ± SD) for MSCs isolated from healthy and T1D donors P1–5 (n = 4 each). (D): Population doubling rate per week for cells from HC (n = 4), ET1D (n = 4), and LT1D (n = 4) donors at P1. Box plot whiskers indicate minimum to maximum. ∗∗, p < .01. Abbreviations: BM-MNC, bone marrow mononuclear cell; CFU-F, colony-forming unit fibroblast; ET1D, early-stage T1D; HC, healthy control; LT1D, late-stage T1D; MSC, mesenchymal stromal cell; ns, not significant; P, passage; T1D, type 1 diabetes.

