Figure 6.
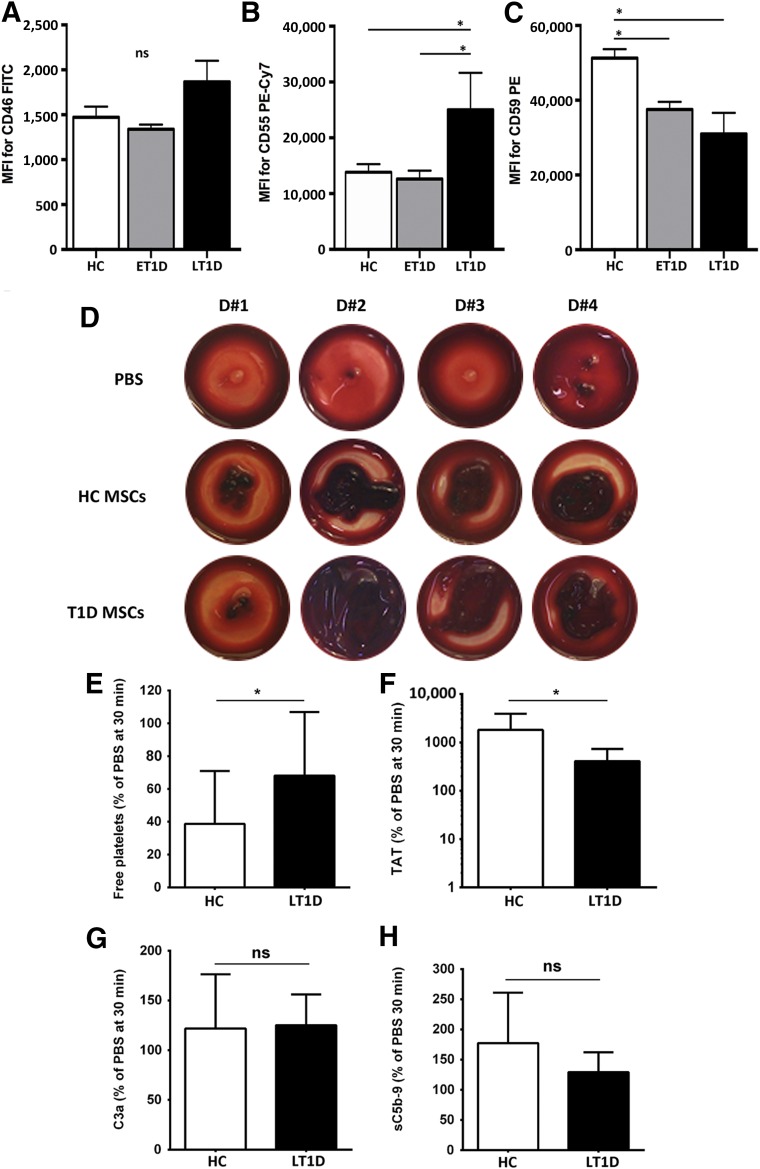
Hemocompatibility profiling of MSCs from HC and T1D donors. Cell surface expression of complement inhibitors CD46 (A), CD55 (B), and CD59 (C) was assessed by flow cytometry on HC, ET1D, and LT1D MSCs (n = 4 donors per group) at P2. Data are expressed as median fluorescence intensity (MFI) ± SEM and analyzed using Mann-Whitney U test; ∗, p < .05. Early passage MSCs (P2–3) from HC or T1D donors were tested for triggering of the instant blood mediated inflammatory reaction (IBMIR) after exposure to nonanticoagulated whole blood in the Chandler blood loop model (n = 10 per group). (D): Representative photographs of clot formation from 4 donors from each group after a 60-min incubation of blood with HC or T1D MSCs (15,000 cells per milliliter) or PBS buffer as negative control. (E): Detection of coagulation and complement activation markers after treatment of blood with MSCs (mean ± SD): free platelets (% relative to PBS, 30 minutes time point), and ELISA quantification of TAT, complement C3 activation fragment a (C3a), and soluble C5b-9 complex (sC5b-9). Significance was analyzed with paired t test (same blood donor exposed to different MSCs); ∗, p < .05. Abbreviations: BM-MNC, bone marrow mononuclear cell; C3a, complement C3 activation fragment a; CFU-F, colony-forming unit fibroblast; Cy7, cyanine 7; ET1D, early-stage T1D; FITC, fluorescein isothiocyanate; HC, healthy control; LT1D, late-stage T1D; MFI, median fluorescence intensity; MSC, mesenchymal stromal cell; P, passage; PBS, phosphate-buffered saline; PE, phycoerythrin; T1D, type 1 diabetes; TAT, thrombin-antithrombin complex.

