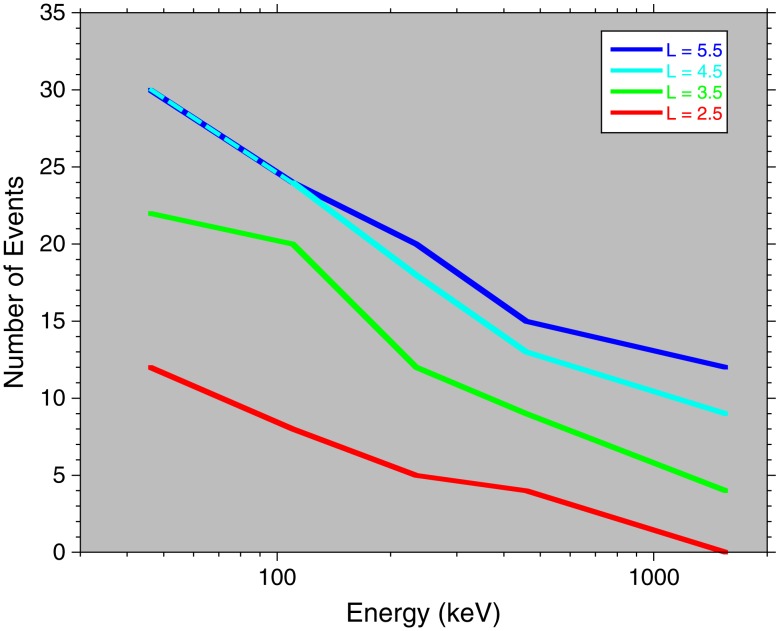
Figure 3.
The number of radiation belt enhancement events in the first 6 months of 2013 as a function of energy at L shells ranging from 2.5 to 5.5. We identify enhancement events visually when line plots of fluxes at fixed L shell show rapid increase, slower decay, and exceed a fixed flux threshold. At all L shells there are more events at lower energy than at higher energy. At a given energy fewer events penetrate to lower L shells than are observed at higher L shells. Most events that penetrate to L = 5.5 also penetrate to L = 4.5, but few of them penetrate to L = 2.5.

