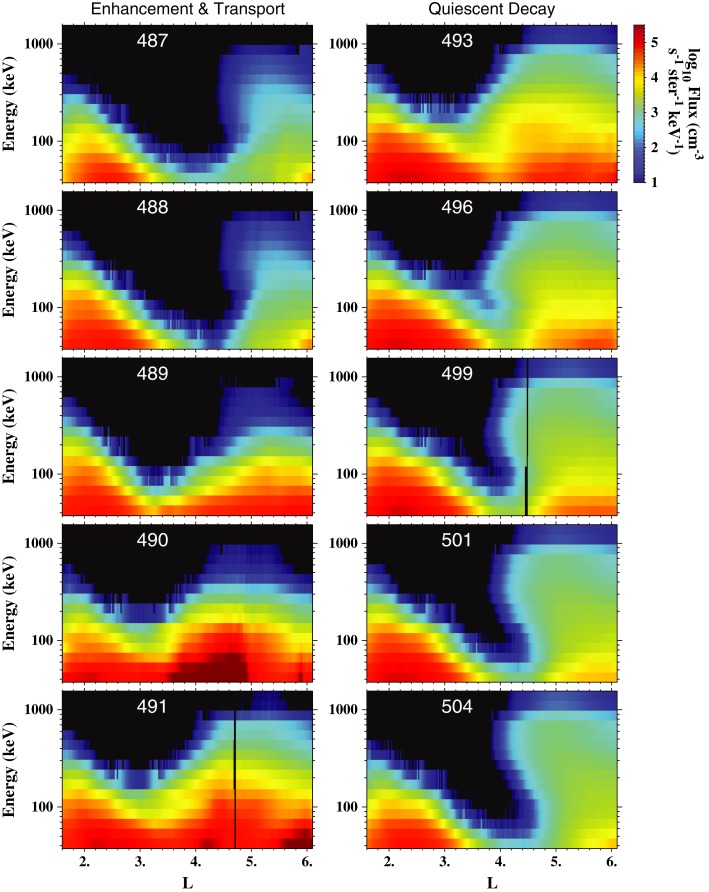
Figure 6.
Color‐coded MagEIS background‐corrected electron fluxes plotted as a function of energy and L shell. Only inbound passes from RBSP‐A are plotted. (left column) (Orbits 487–491) the enhancement and transport of electrons over ~2 days. (right column) Selected orbits over the ~4 days following the event when electron fluxes were decaying.

