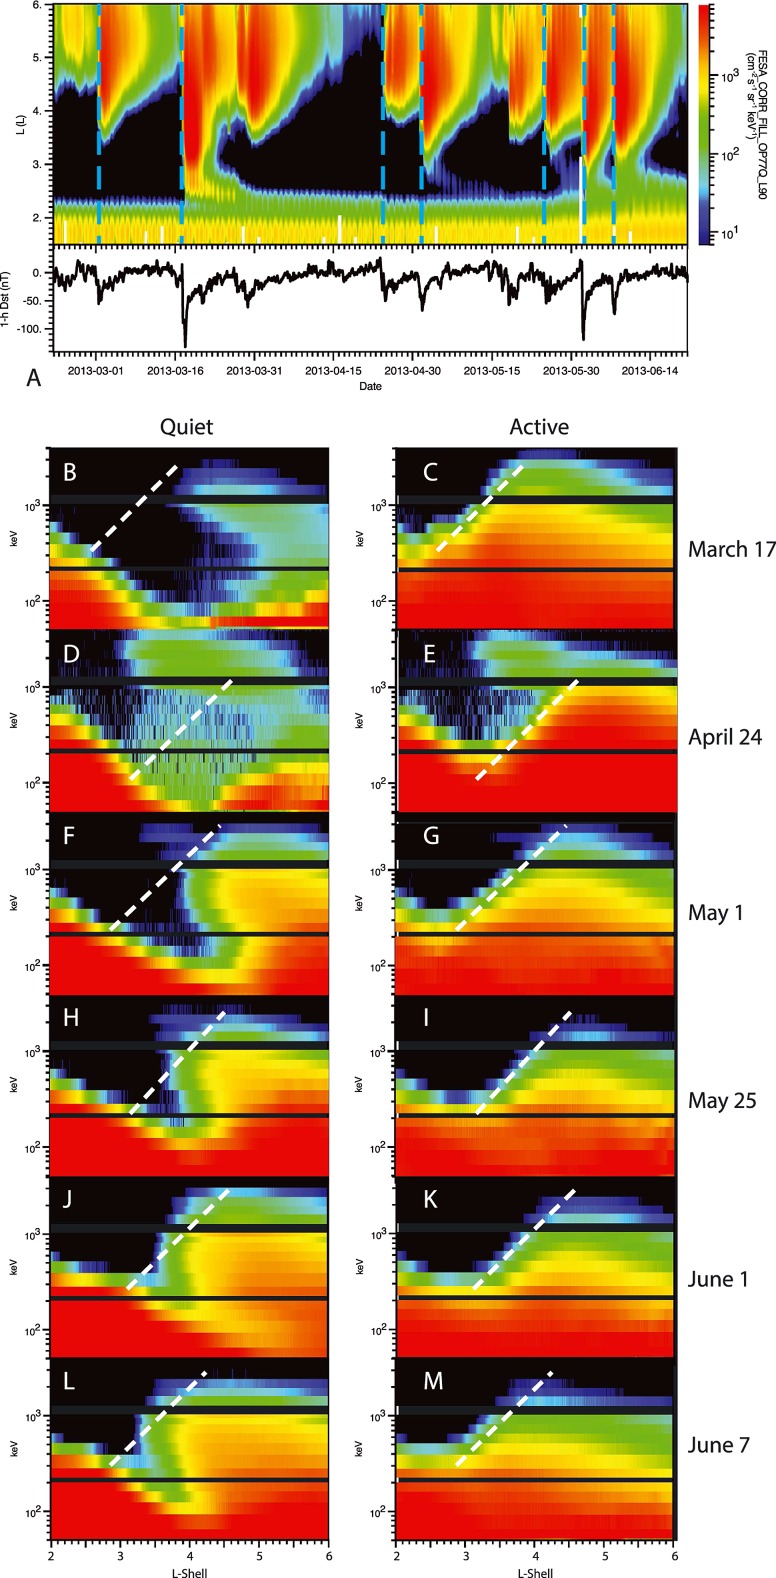
Figure 12.
Energy‐dependent dynamics for five additional events in 2013. (a) 459 keV flux as a function of L and time along with the Dst index. Event times are marked with dashed lines. (b–m) Flux as a function of energy and L shell for individual orbits prior to an enhancement event (Figures 12b , 12d, 12f, 12h, 12j, and 12l) and during the active part of the event (Figures 12c, 12e, 12g, 12i, 12k, and 12m). Figures 12b–12m use arbitrary color scales that keep the dynamic range approximately the same for each event. The orbits plotted are Figure 12b: 529; Figure 12c: 535; Figure 12d: 633; Figure 12e: 637; Figure 12f: 651; Figure 12g: 655; Figure 12h: 713; Figure 12i: 718; Figure 12j: 732; Figure 12k: 737; Figure 12l: 748; and Figure 12m: 753.

