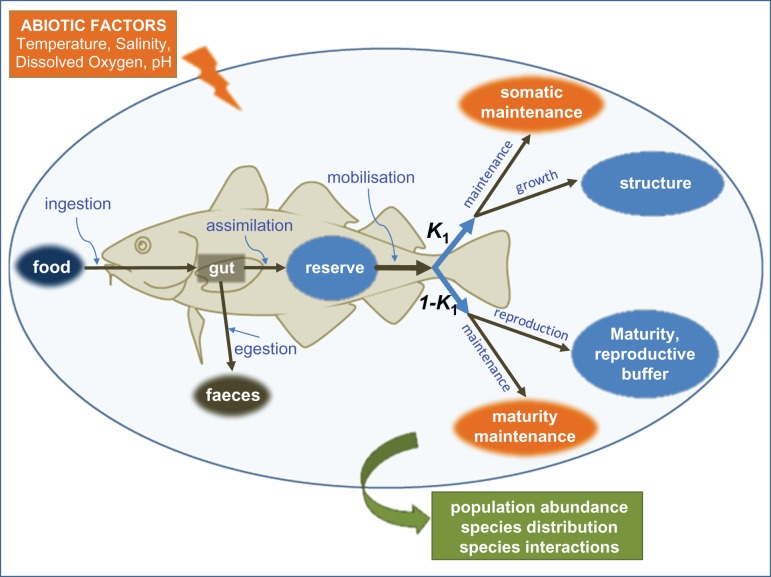
Figure 5:
Schematic representation of the standard dynamic energy budget (DEB) model showing the paths of energy flow through a fish (or any organism). Sources or sinks of energy are shown as green, brown and orange ovals; the blue ovals are the three state variables describing the organism. Processes affecting energy flows are indicated by black arrows. A defining feature of DEB models is the existence of reserves, from which allocation rules (proportion K1) define the partition of energy among processes such as maintenance (somatic or gonadal), somatic growth and reproduction. Dynamic energy budget models can be parameterized to account for effects of abiotic variables, and their universal principles allow for interspecific comparisons of parameter estimates. See Teal et al. (2012) for details of an application to evaluate and project marine fish habitat suitability.

