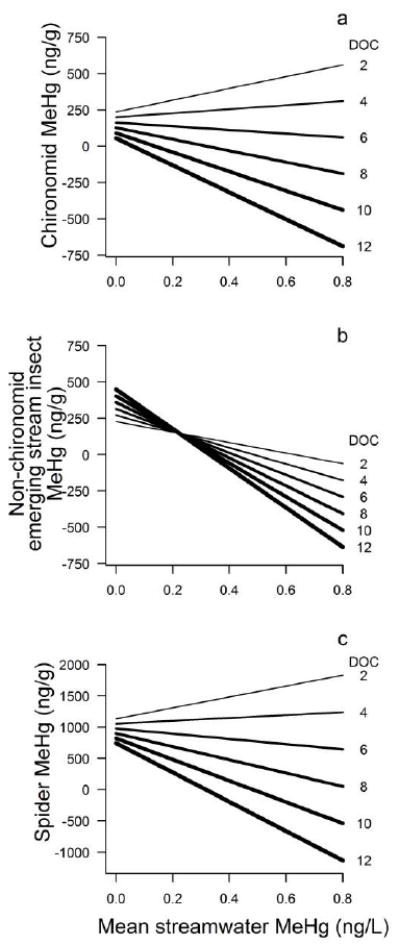
Figure 3.

Response surfaces for the interactive effects of DOC concentration and streamwater MeHg concentration on the body MeHg concentration of the focal organisms associated with stream in the Lake Sunapee watershed, NH. Each line represents the relationship between body MeHg concentration and streamwater MeHg concentration at a particular DOC concentration, in mg C/L, based on the statistical models reported in Table 2.
