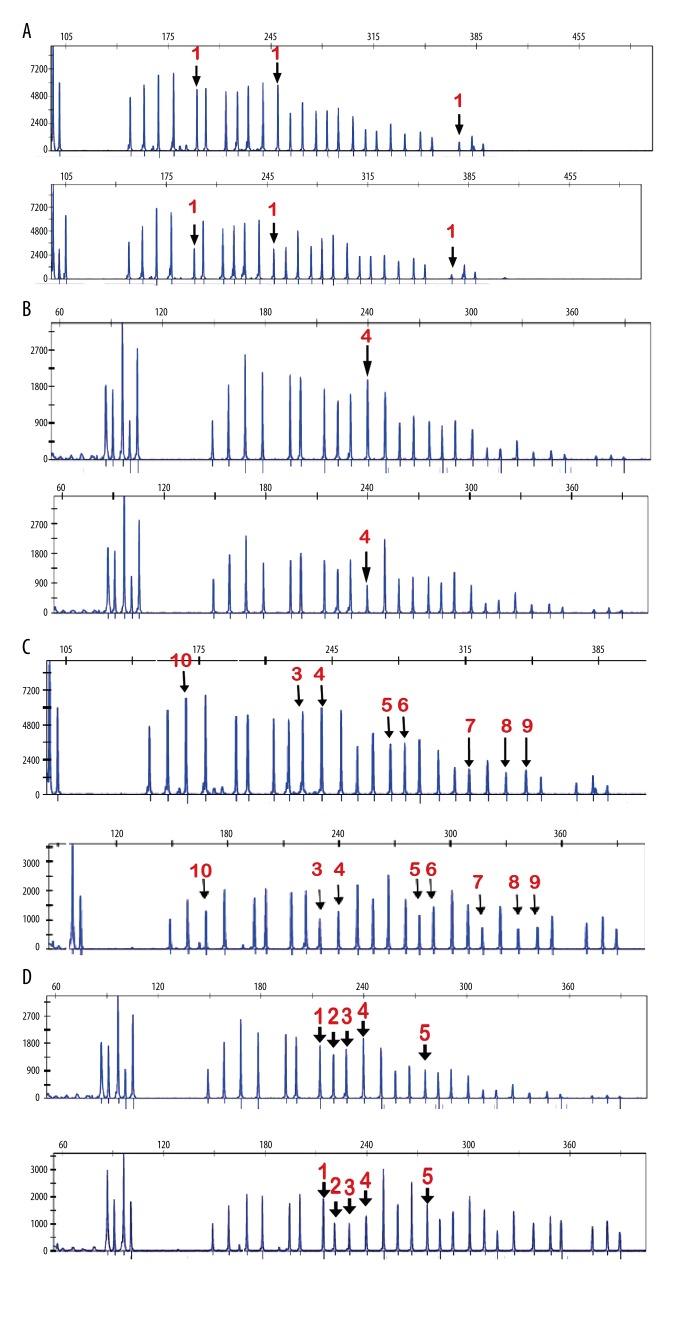
Figure 4.
Peak patterns of exons from LKB1 gene in MLPA assay. The x-axis shows the size of PCR products, and the y-axis reflects the relative quantity of PCR products. (A) Deletion in exon 1 was detected in 1 case. Top shows the amount of every PCR product from normal controls. Bottom shows the amount of every PCR product from familial PJS patients. (B) Deletion in exon 4 was detected in 1 case. Top shows the amount of every PCR product from normal controls. Bottom shows the amount of every PCR product from familial PJS patients. (C) Deletions in exon 3–10 were detected in 1 case. Top shows the amount of every PCR product from normal controls. Bottom shows the amount of every PCR product from familial PJS patients. (D). Deletions in exon 2–4 were detected in 1 case. Top shows the amount of every PCR product from normal controls. Bottom shows the amount of every PCR product from familial PJS patients. Red numbers represent exons.

