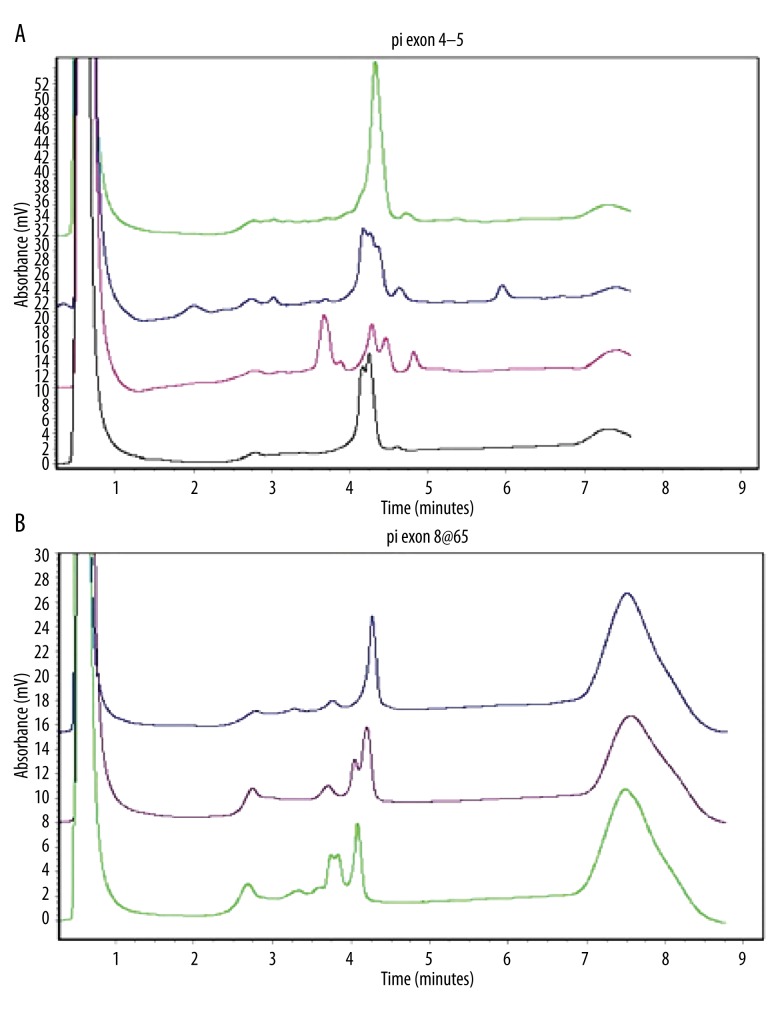
Figure 7.
The representative PCR-DHPLC elution maps. (A) The elution maps from top to bottom for normal controls, the 734+5G>A mutation in intron 5, the deletion 471_501delTTCTGTCAGCTGATTGACGGCCTGGAGTAC in exon 4, and the 701T>A mutation in exon 4. (B) The elution maps for normal controls: the 924G>C mutation in exon 8 and the 1062C>G mutation in exon 8, respectively.

