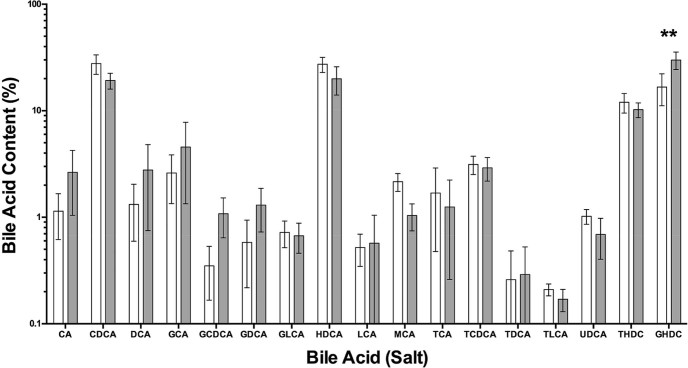
Fig. 2.
The average bile acid composition (% of total bile) in mucus samples taken from the intestines of pigs fed either the control diet (white) or OM10 diet (grey) plotted on a log scale. Data are presented as the mean ± sem, n = 5 per group. Statistical significance was determined using a 2-way ANOVA (**P < 0.01 vs control Diet).

