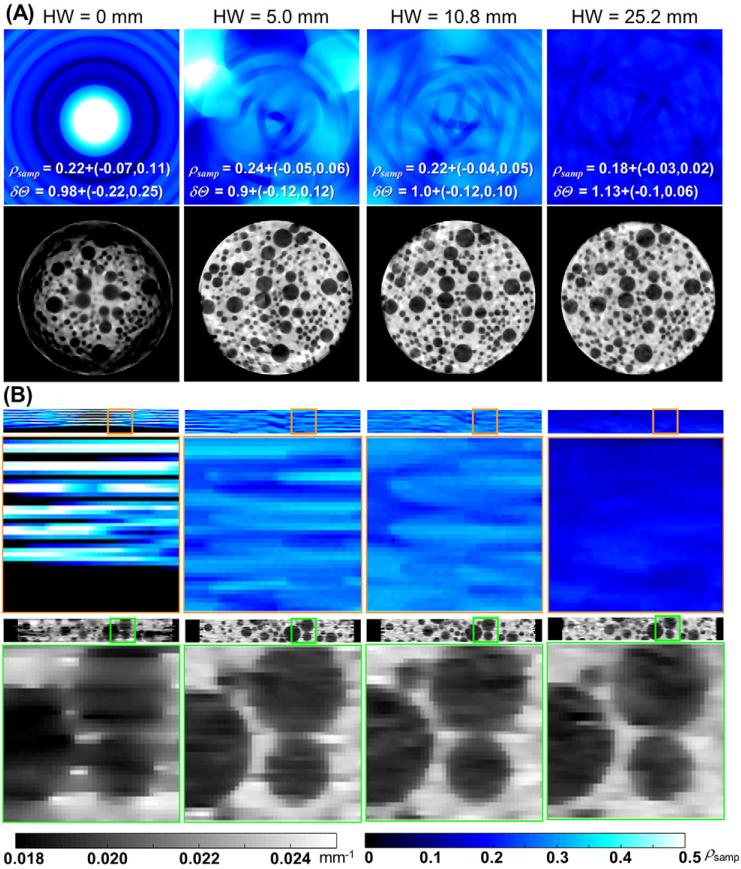
Figure 3.
Axial (A) and coronal (B) planes of sampling density ρsamp (top row) with increasing helical width HW. The reconstructed images (bottom row) of simulated tomographic data showed direct correspondence between spatial variations in sampling and the presence of artifacts and/or spatially varying image quality. Labels depict median and interquartile range for ρsamp and δΘ.

