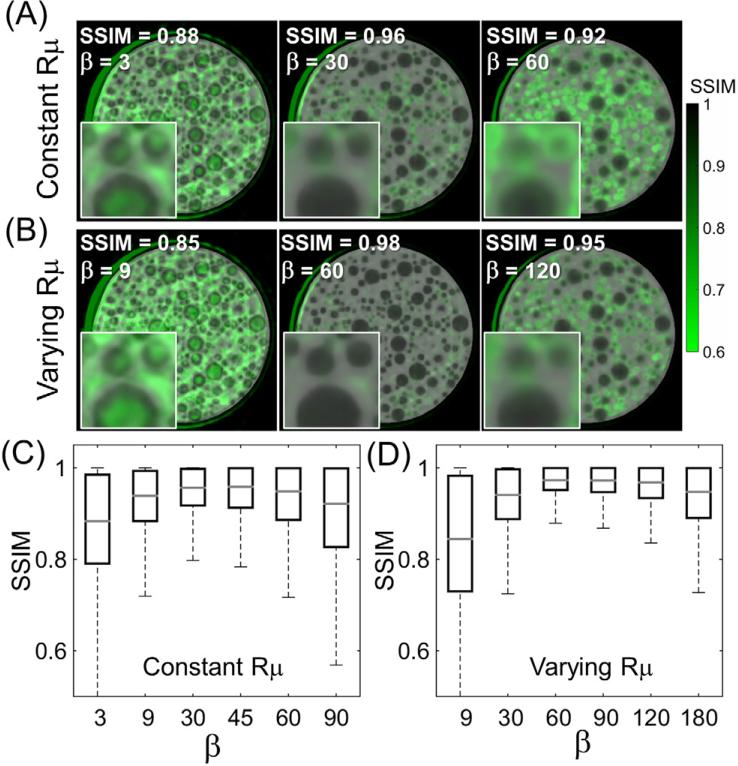
Figure 5.
The effect of (A), (C) constant or (B), (D) spatially varying penalties. In (A) and (B), the SSIM is overlaid in green-scale, and the three columns represent reconstructions at approximately matched median SSIM (shown in the label at the top-left corner of the images). In (C) and (D) the SSIM distributions are quantified as box-and-whisker plots for the spatially constant and spatially varying regularization methods, respectively. Note the larger maximum value of median SSIM and more homogenous distribution in SSIM for the spatially varying penalty.

