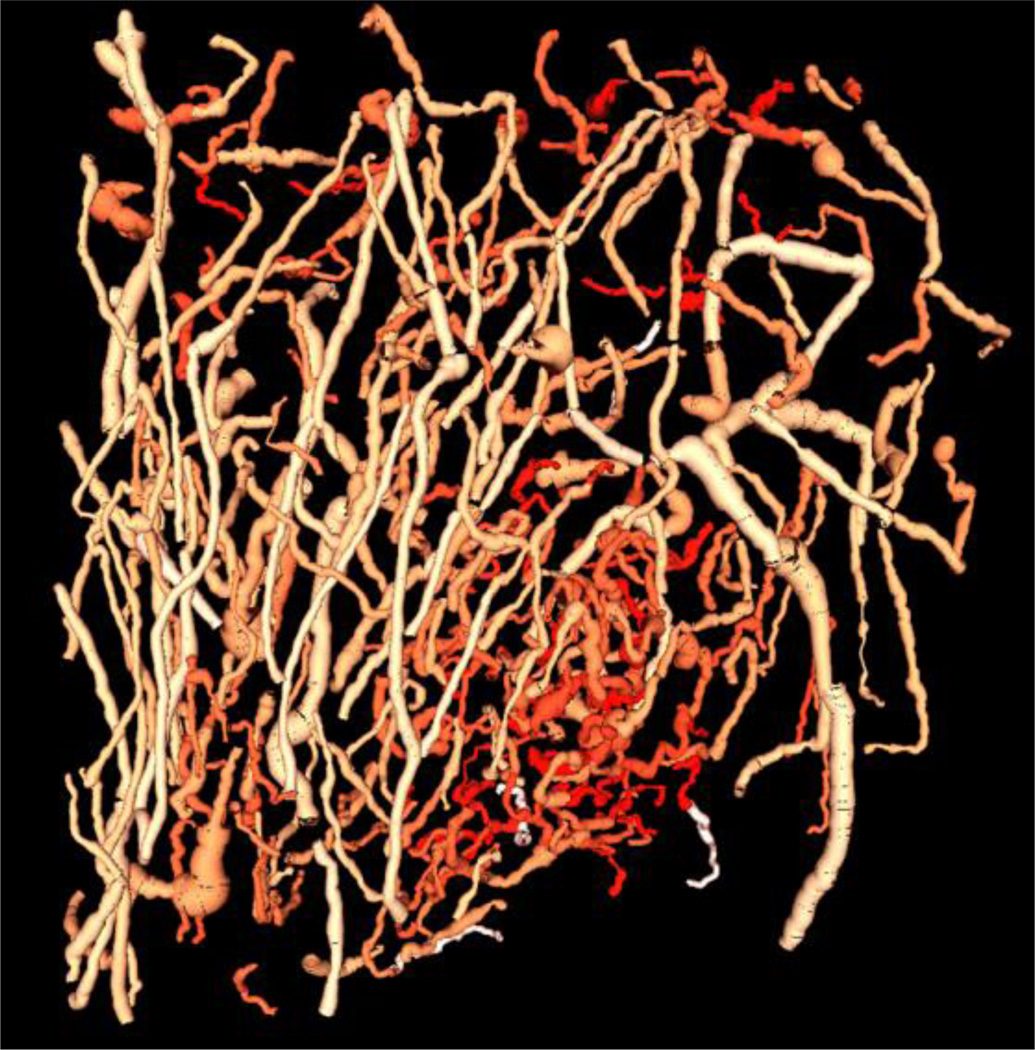
Figure 4.
Color map rendering of the SOAM values for each blood vessel isolated from the acoustic angiography image volume. Intense reds indicate higher SOAM values which are concentrated in the tumor region, while less intense red colors indicate lower SOAM values. This image was generated in VesselView (www.tubetk.org) using custom code provided by Kitware Medical Imaging (Carrboro, NC).

